Python as a tool to analyze data, create visualizations and use machine learning algorithms
Miloš Bijanić held a two-day workshop within the FONup project
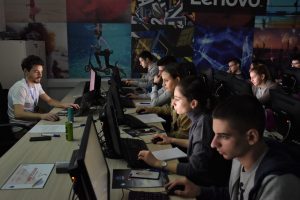
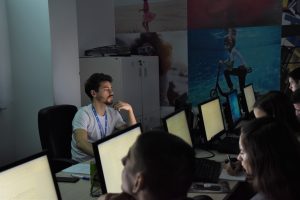
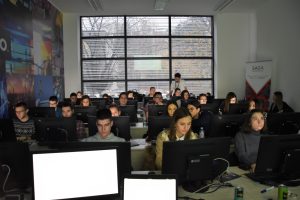
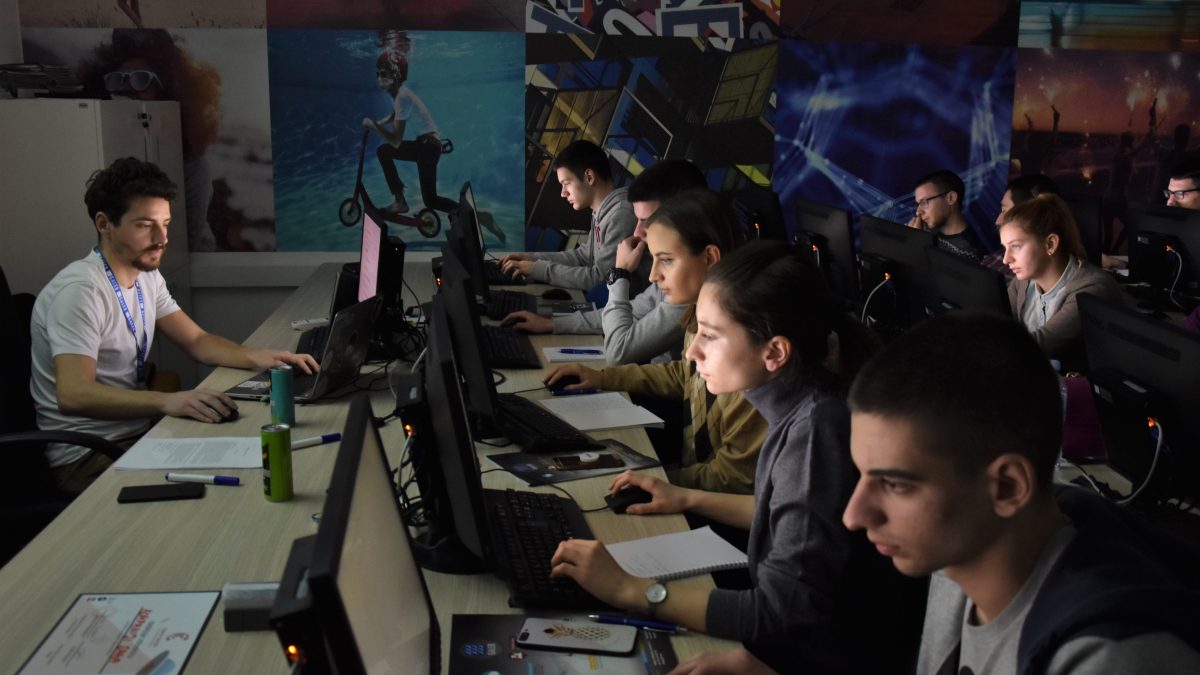
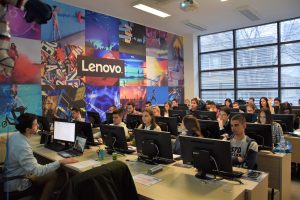
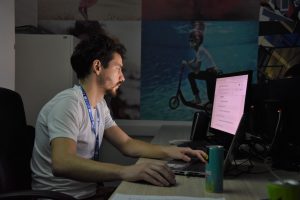
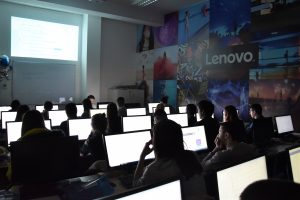
We supported the FONup project, organized by FON’s Career Development Center, which is aimed at all IT students, those who are curious and always willing to hear current topics in the IT field. Our colleague Milos Bijanić held workshops on December 7th and 8th at the Faculty of Organizational Sciences, entitled “Python for Data Science”.
Our colleague aimed to introduce the students to the Python programming language as a tool to analyze data, create visualizations, and use machine learning algorithm. Participants also had the opportunity to get familiar with:
- Pandas and Numpy libraries for data analysis
- Seaborn and Matplotlib libraries for data visualization
- SciKit-Learn as a library for building machine learning models
- How to evaluate model results.
Through this workshop we tried to guide the participants through the whole process of digitization, what it means and what value it has for the economy, then how much the economy has become aware of what the data is, what are the ways and approaches to apply that data in every kind of business, to ultimately work together to understand that data-driven experience.
The beginning of the 21st century was based on the construction of technological information systems that would replace human power, that is, automate some processes. Now that large amounts of data have been collected, it has come to the point that these data contain some value and give some additional hidden behavior, and companies have recognized it. We tried to go through the data in this workshop, understand the behavior and history of clients, and create predictive models. We did various visualizations, where the students described whether two attributes can be correlated and what is the correlation if they have one. Through visualizations, we can come to a conclusion as a human being, and through two parameters to say whether our client will take some products or will leave our business. This workshop used data from the telecommunications industry.
The essence of the workshop was the participants’ understanding of how to identify a problem, how it can be seen through data and how to present it to us through various visualizations and manipulations of data. However, how is this behavior that we have seen as a human being trying to give a model, that the model sees the same, and that later the model can automatically work for us. That is, to integrate some of the behaviors we have observed, and for some new example of a user who comes to us to be able to evaluate whether or not to leave a telecommunications company.
Our workshop, which lasted 8 hours over two days, was attended by over 25 students who were really interested in the subject and were active until the very end. Our colleague Milos had the difficult task of selecting the two best and most active students, as they all were involved all the time.
